In our most recent blog post of this series, Playing the Long Game, we broke down the first step towards effective population health monitoring, which we refer to as “Identification” (i.e., getting the patient to patient and patient to provider relationship correct). Once that box is checked, organizations can begin to understand the experience (cost/utilization) of their populations. This leads us to the next phase of population health monitoring which is “Tracing”.
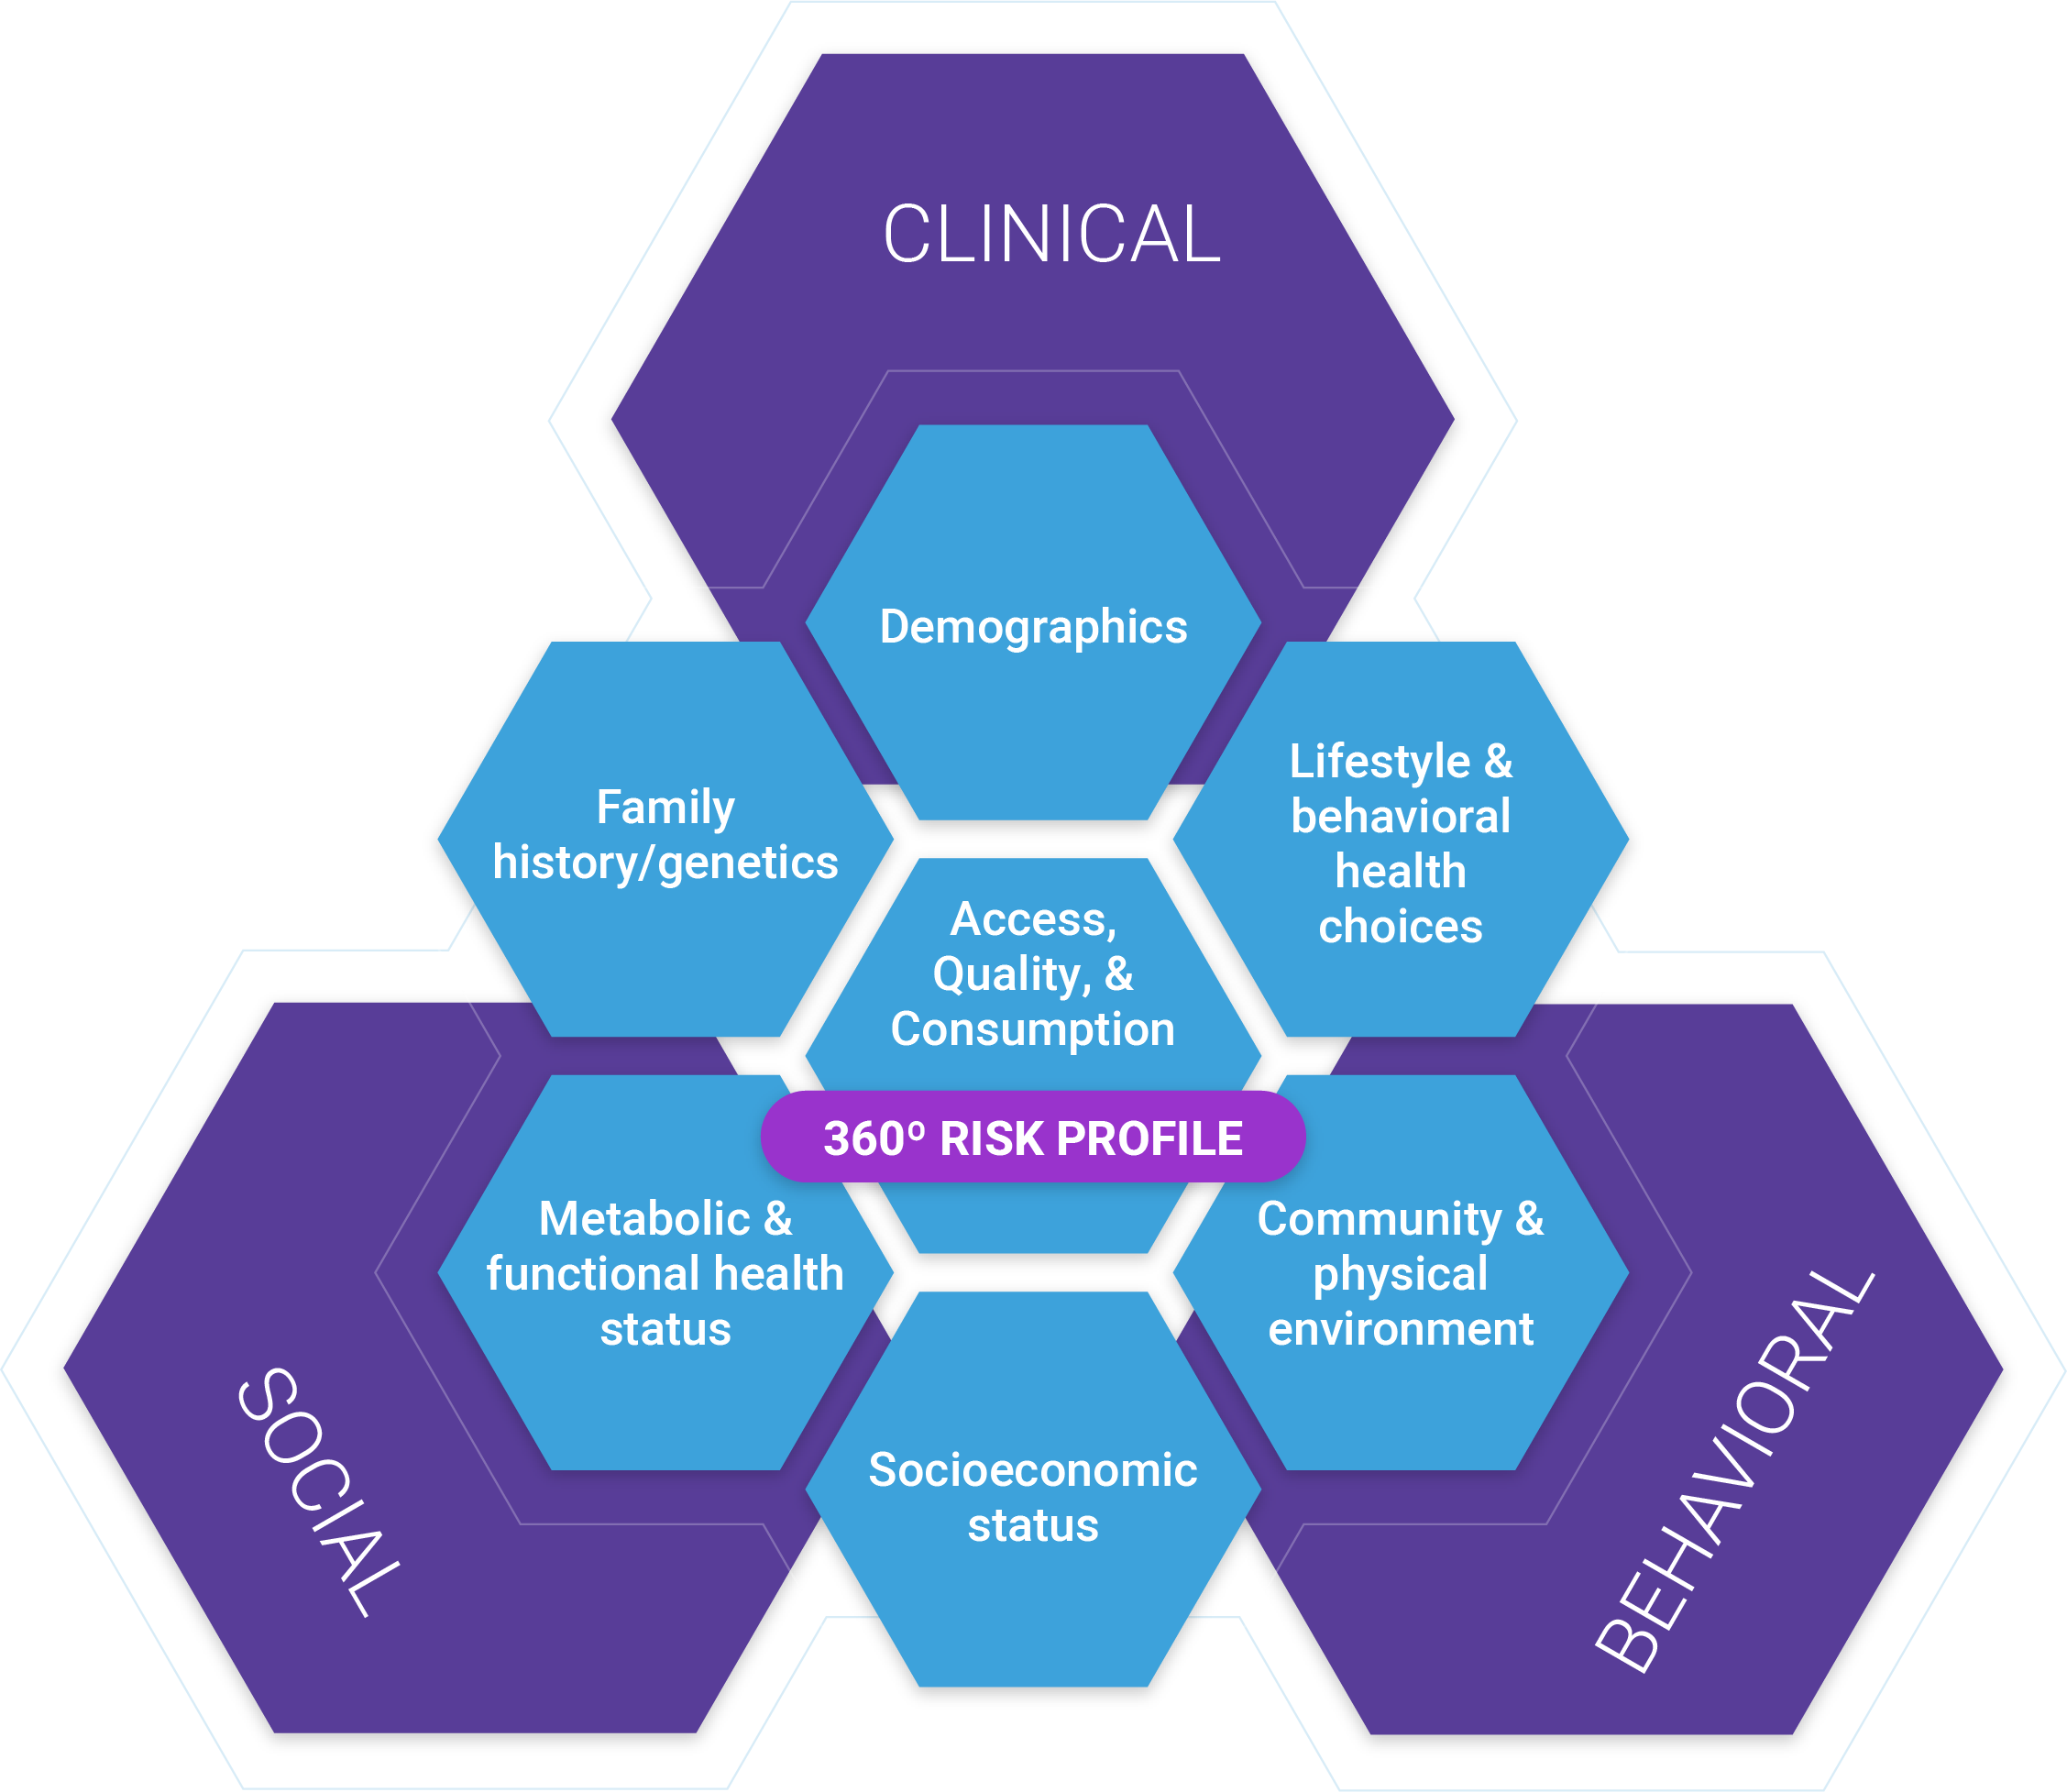
The primary objective of Tracing is to build a comprehensive risk profile for each patient, often referred to as the 360-Degree patient profile. A 360-degree patient profile considers many dimensions of clinical, behavioral, and social risk over time. The 360-degree patient profile provides the foundation required for most activities performed in care management, including health assessments, risk capture, gap closure, case coordination & management, as well as program planning and evaluation.
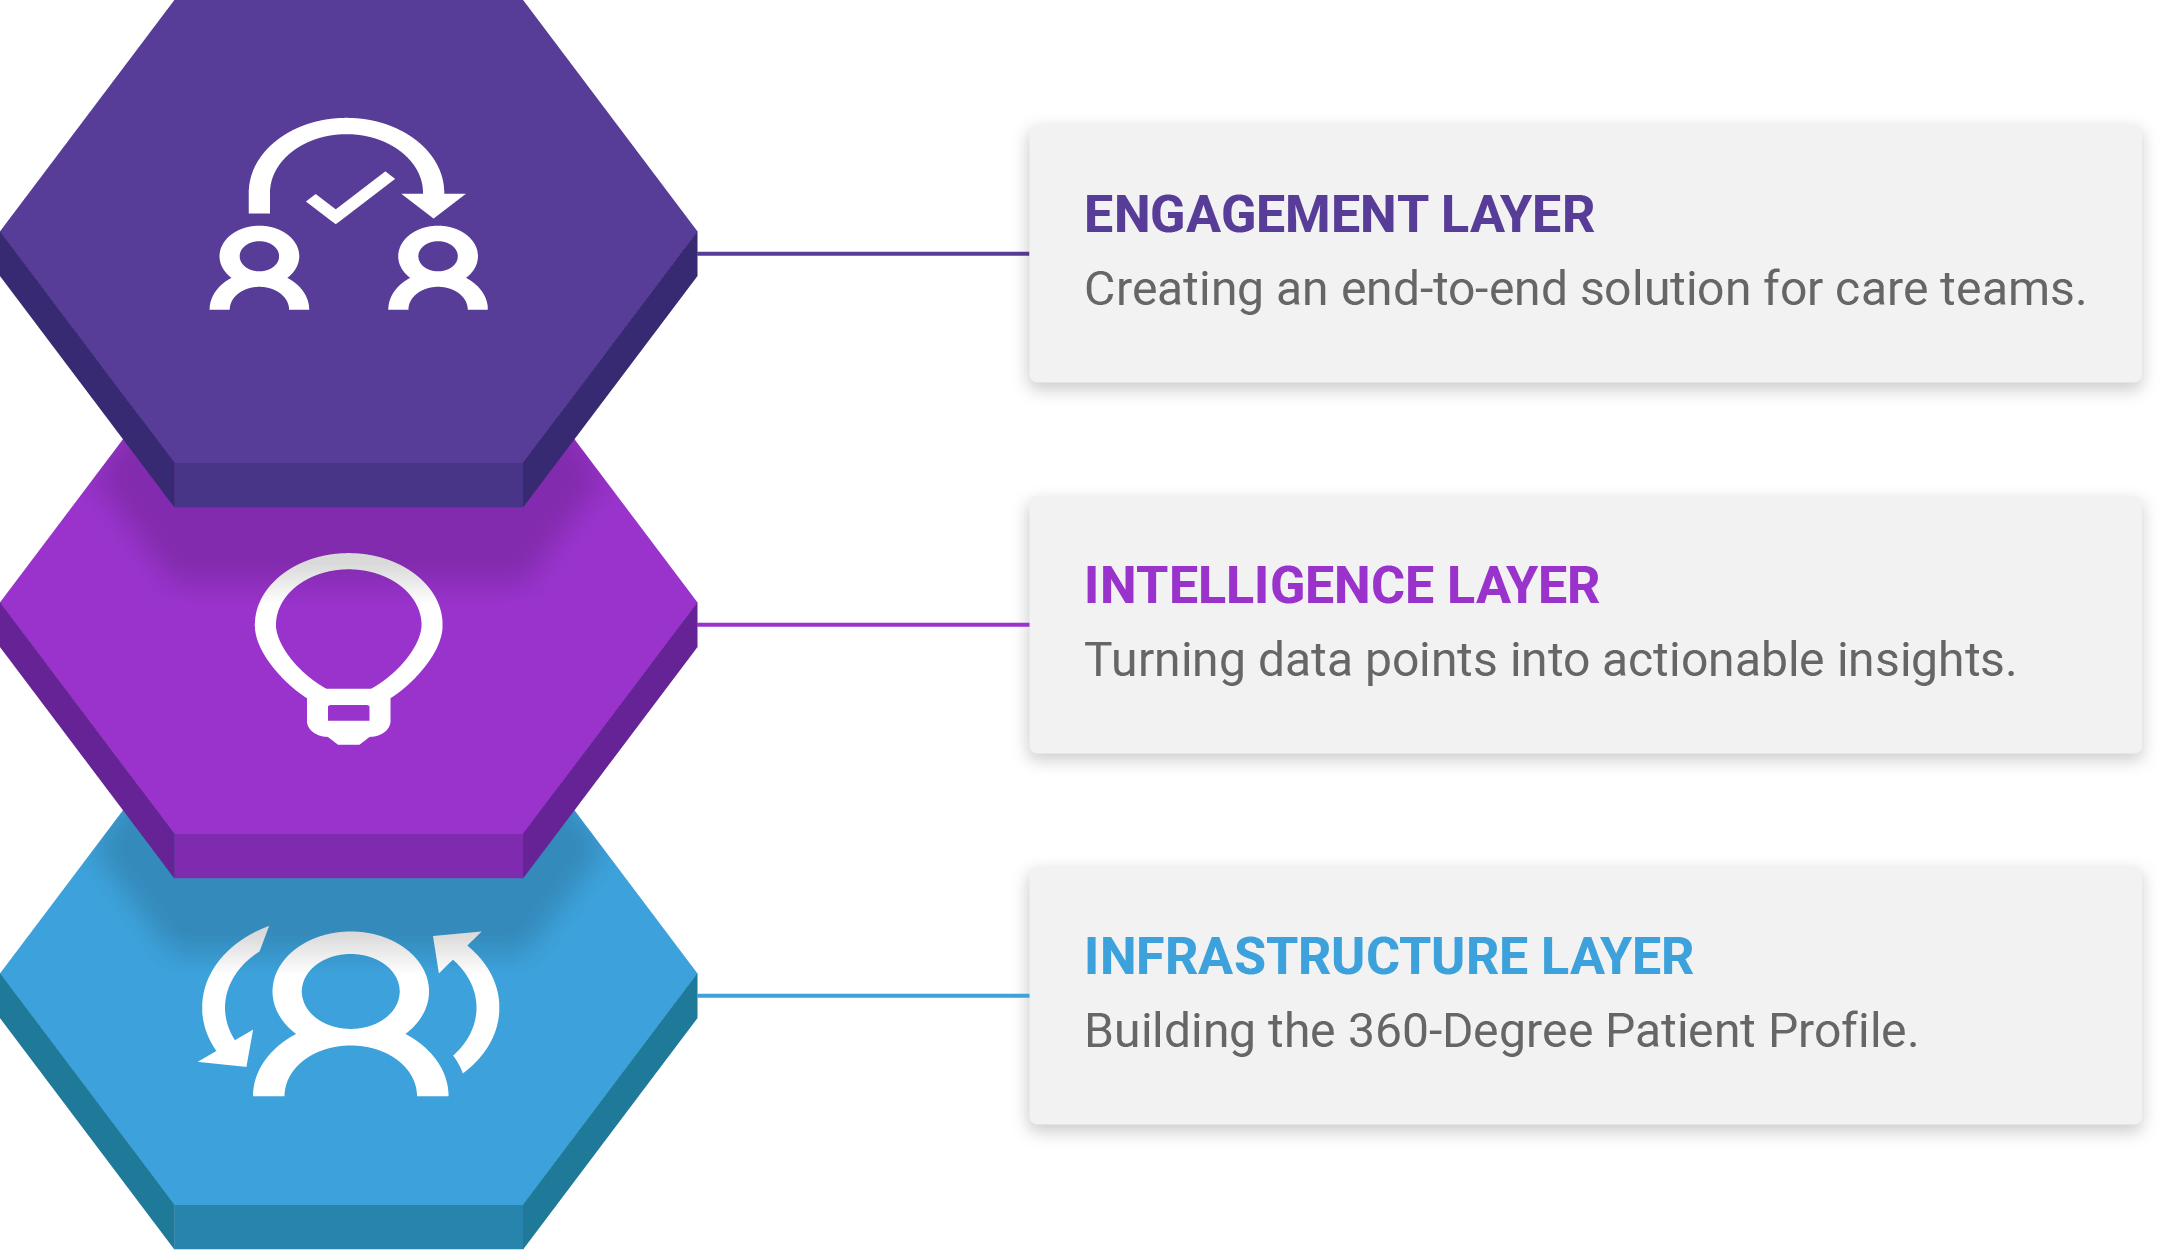
The Three Data Layers in a Care Management Platform
In a care management platform, data is captured, organized, and used across three distinct layers: infrastructure, intelligence, and engagement. At the infrastructure layer, we have the 360-Degree Patient Profile – a common data set on which all care management activities are based on. This layer includes all of the features of warehousing, ETL, and data management to capture, curate, and share information.
Sitting on top of the infrastructure layer are the intelligence and engagement layers, where data variables are converted into meaningful, actionable, and consumable insights that can be shared with clinicians across the full spectrum of care management activities. We’ll discuss the intelligence and engagement layers in more detail, in a future blog post.
Three Steps to 360-Degree Patient Profiling
At a high level, there are three workflows within the Infrastructure layer that form the 360-Degree Patient Profile. First, raw data is collected from various sources, it’s normalized, cleansed, standardized, and stored in an integrated patient-centered data warehouse. Included in this workflow should be a master patient indexing solution, to identify, match, merge, de-duplicate, and cleanse records to maintain an accurate, complete view of the patient. In addition to the EMPI implementation, the patient-centered data warehouse needs to apply industry standardized, customizable, configurable, and strong data validation rules.
Once the raw data is collected and stored, we can begin to combine the variables across the raw data sources to create a more complete picture of the patient’s health journey. We can augment Diagnosis codes with laboratory and pharmacy data to identify potential risk in low utilizers; segment patients at rising risk based on pathology results. We can use social information to better understand the unique needs of each patient and to put them into contact with social supports.
Capturing these data elements over time and across plan memberships allows us to understand risk beyond a calendar year. We can see encounters, diagnoses, procedures that go beyond the 12 month observation period to truly understand the patient’s health journey.

The Raw Data needed to build the 360-Degree Patient Profile
Most 360-Degree profiling solutions focus on identifying medical conditions first. Once clinical risk is captured, the patient’s profile is augmented with behavioral and social risk strata. There are many sources and types of data, all with different uses and degrees of validity. Predictive modeling is increasingly embracing wide-ranging sources such as social data (patient and community level), device data (e.g., wearables), consumer data (purchasing behavior), as well as the traditional data types like EHRs, claims, and enrollment data.
Each source has its advantages and disadvantages. As with any data-driven activity, predictive modeling is subject to the “garbage in, garbage out” rule. For the most part, healthcare data is not well standardized, it’s not linear, and in many cases very unstructured. In addition to these challenges, healthcare data is not always available or easily accessible at the patient level.
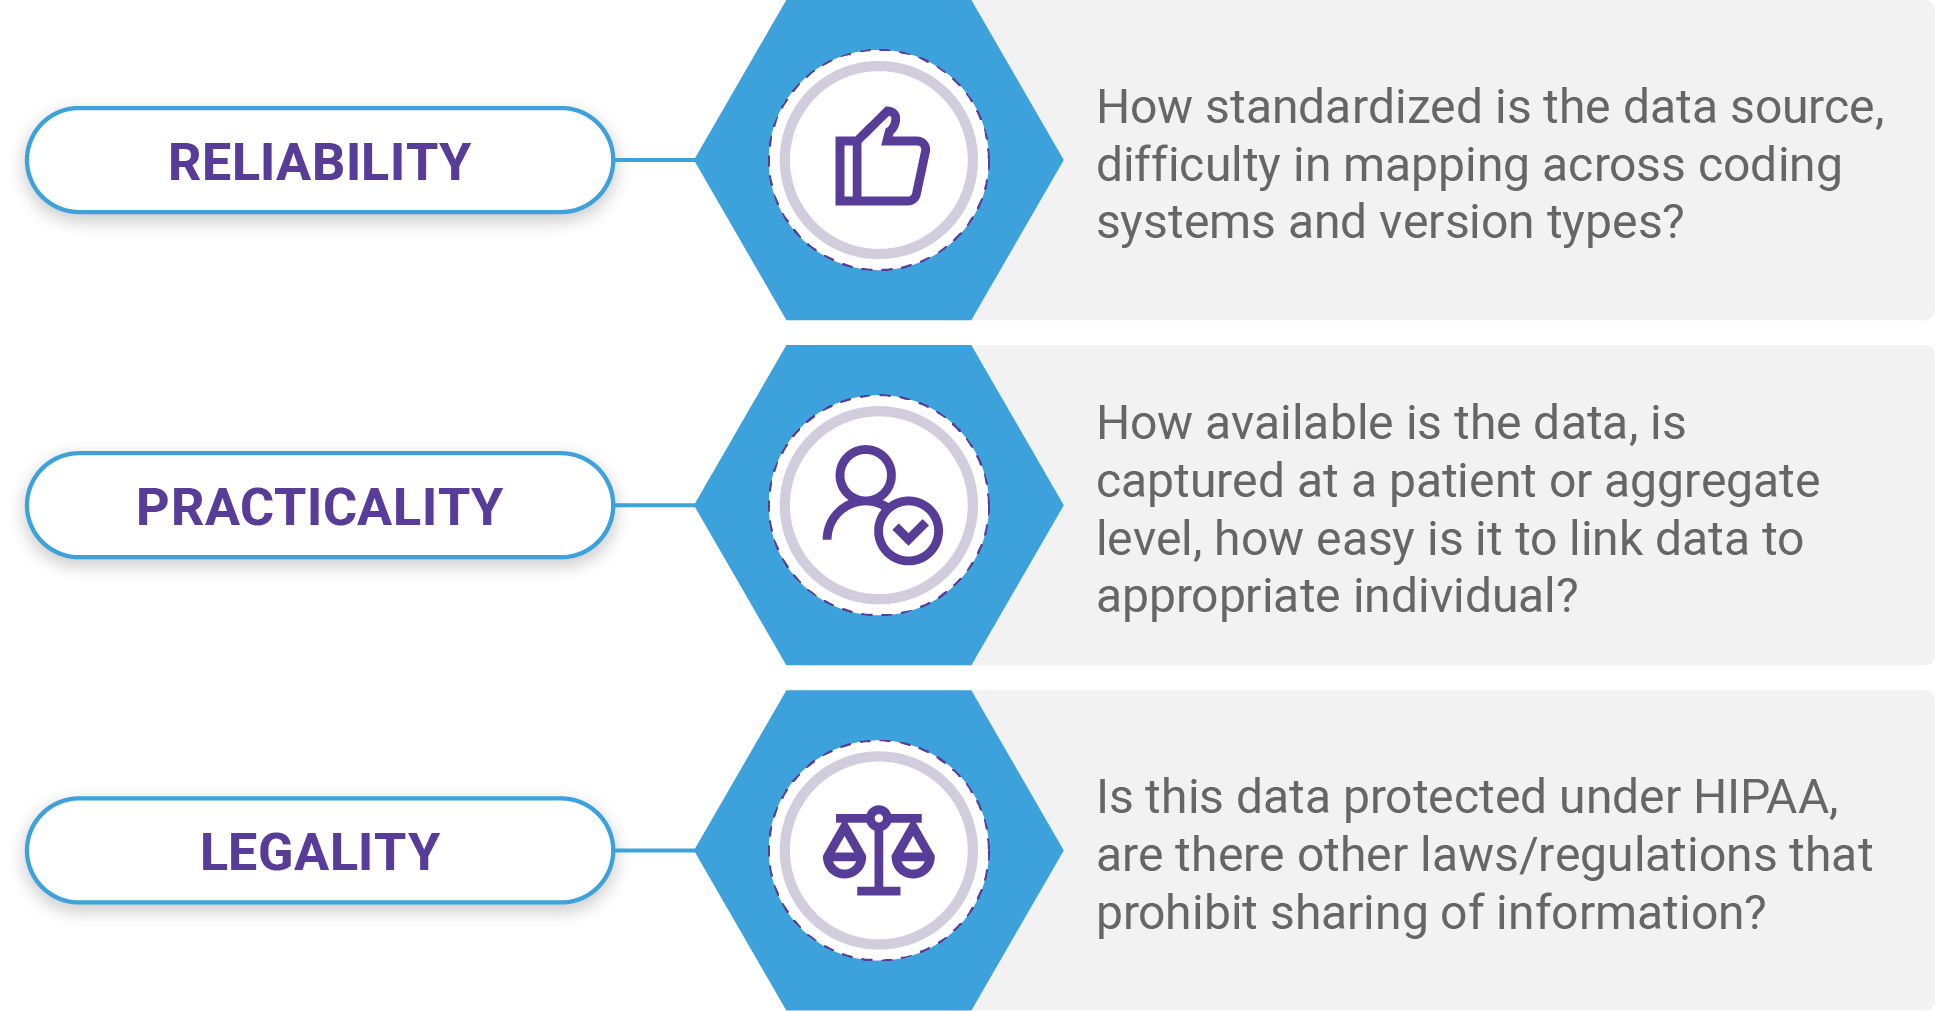
Let’s take a closer look at some of the major data types used to build the 360-Degree patient profile and how each of these stack up in terms of data reliability, practicality, and legality.
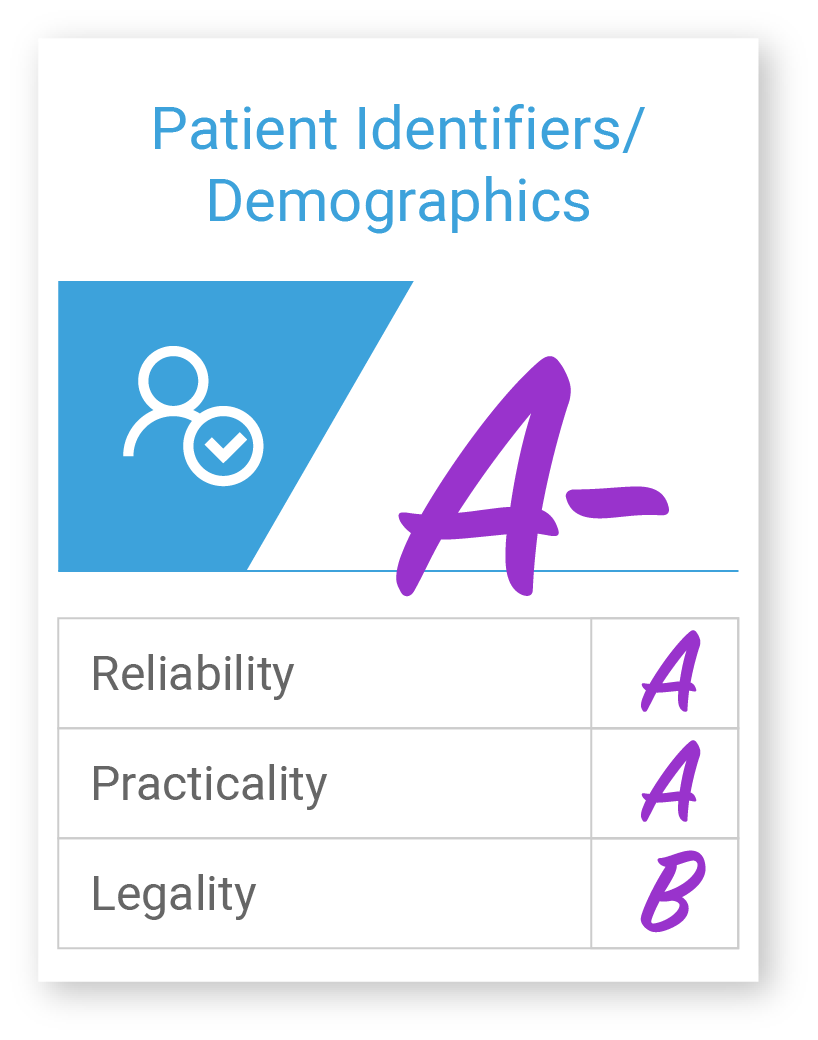
Patient Identifiers / Demographics
Patient identifiers and demographic data types include first and last name, date of birth/age, sex/gender, ethnicity/race, address, phone numbers, etc. Patient identifiers and demographics are important across all care management activities including Patient identity management, attribution, as well as stratification, and clinical screening.
These details come from many sources – claims, enrollment/eligibility, Electronic Health Record systems (EHRs), Health Information Exchanges (HIEs), etc.; making it a practical source of data. Federal mandates and established standards for collecting these details make it a highly reliable variable as well. DOB is considered protected under HIPAA, so there are sharing limitations.
Diagnoses
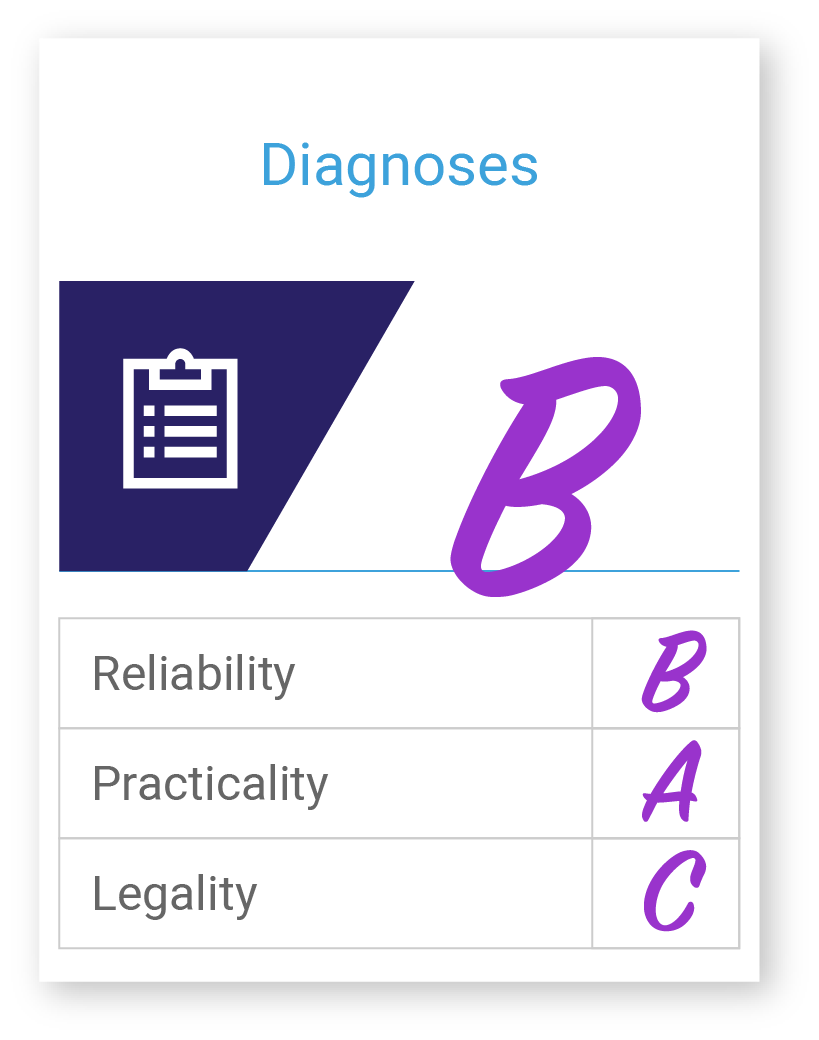
Diagnoses data types include but are not limited to, disease/conditions, signs of illness, symptoms, injuries, genetics, and family history. Diagnosis data is extremely important in care management as well as risk adjustment for reimbursement. For example, complex care management programs aim to identify patients with certain chronic illnesses and then are often stratified based on the number of illnesses, the severity, expected trajectory, and history of a diagnosis.
There are many coding standards for documenting diagnoses including, the International Classification of Diseases (ICD), International Classification of Primary Care (ICPC), Systematized Nomenclature of Medicine (SNOMED), Diagnostic and Statistical Manual of Mental Disorders (DSM), and Read Codes. This can create some challenges in using diagnoses data across different coding standards, luckily most EHRs, HIEs, and Claims systems use ICD coding, but even mapping codes across versions can be challenging. There are also legal considerations over the use of HIV and mental health-related diagnoses which are often protected by federal and state-level laws, which prohibit sharing of this information.
Medications
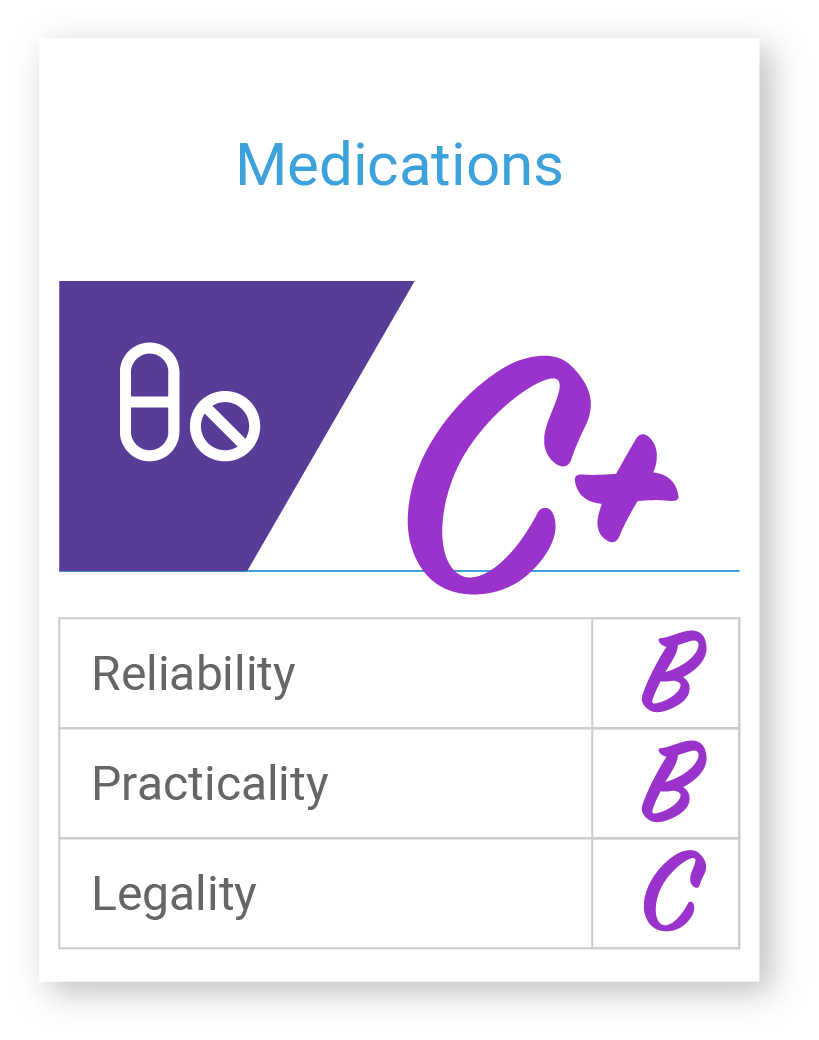
Medication data types can also be used to account for risk in a population across financial and care delivery systems. For example, CMS’s HCC risk adjustment model uses certain high-cost medications as a way to calculate relative risk for a patient/population. Medication data types most often used in care management are prescribed and dispensed details. These two data points can be used to establish medication adherence (e.g., polypharmacy, medical regimen complexity index (MRCI), medication possession ratio (MPR), and medication reconciliation. All very important details to consider in a care management framework. In addition, Medication data can also be helpful when trying to identify missing diagnoses, severity, and procedures when data might be missing.
Medication data is captured using various coding standards including, National Drug Codes (NDCs), RxNorm, Systematized Nomenclature of Medicine’s (SNOMED) Chemical axis (C-axis), and Anatomical Therapeutic Chemical Classification System (ATC). Most patient-level medication data is sourced from Rx claims, EHRs, and HIEs. Many insurers don’t supply provider organizations with Rx claims data which make the practicality of using this data difficult, resulting in provider organization leaning on EHR data solely, which only provides insight into the prescribed medication and not the dispensed/filled medication. There are also legal considerations for HIV status and mental illness Rx. These factors make the practicality and reliability of medication data lower, but certainly not less valuable.
Encounters/Procedures
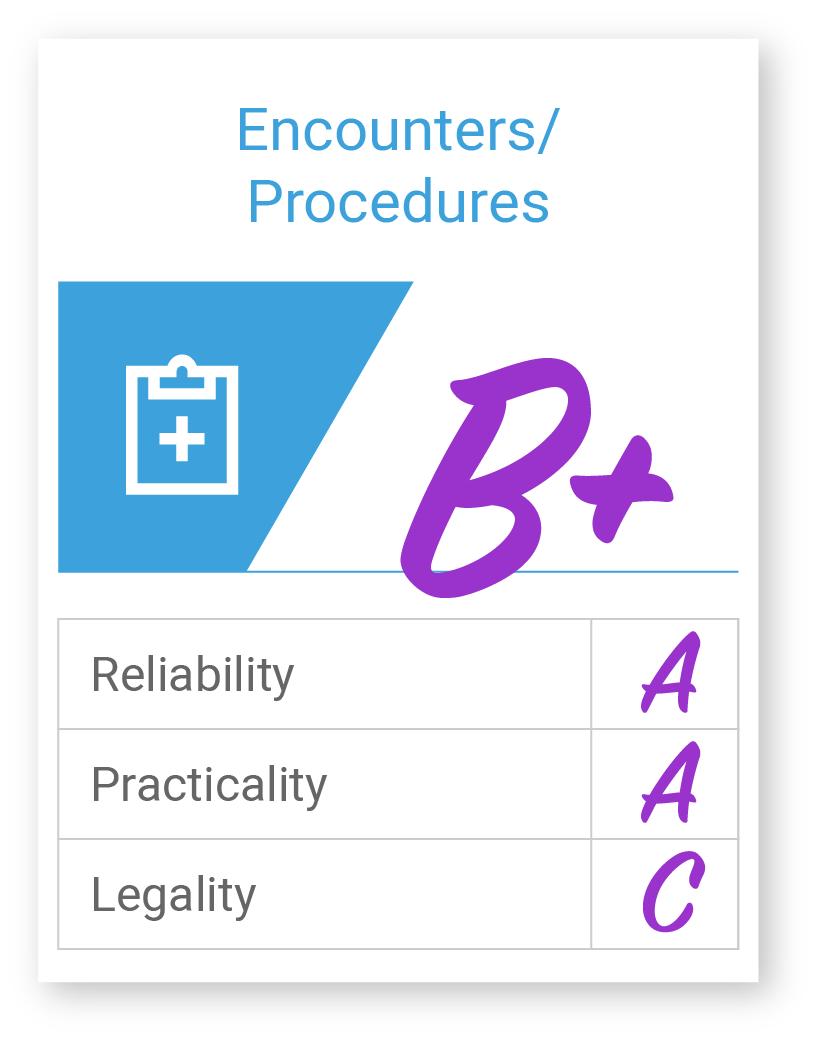
Encounter and procedure data types most often point to administrative and clinical variables like E&M procedures, surgery, radiology, path & lab, as well as visit type, date of appointment (past/future), and chief complaint. Encounter and procedure data is used across a wide range of care management and financial administration activities. Procedure data is a major factor in many risk stratification algorithms used to predict future inpatient hospitalizations, unplanned Emergency Room visits, and other costly events. Similar to medication data, procedures data is also used by analysts to account for missing diagnosis and severity of disease to tell a more complete picture of the patient. Visit type and upcoming appointment dates are also helpful in prioritizing patient outreach to know which patients are already on the books to complete their Annual Wellness Visit (AWV) and therefore don’t require additional outreach efforts.
Encounter and procedural data are found primarily in EHRs and Claims. They are most commonly coded using ICD-CM-9/10, Current Procedural Terminology (CPT) developed by the American Medical Association, and the Healthcare Common Procedure Coding System (HCPCS)developed by the Center for Medicare and Medicaid Services. Federal mandates on procedural coding make this data type fairly reliable and practical for use in care management structures. It’s best used in understanding what took place within a particular encounter.
Utilization/Cost
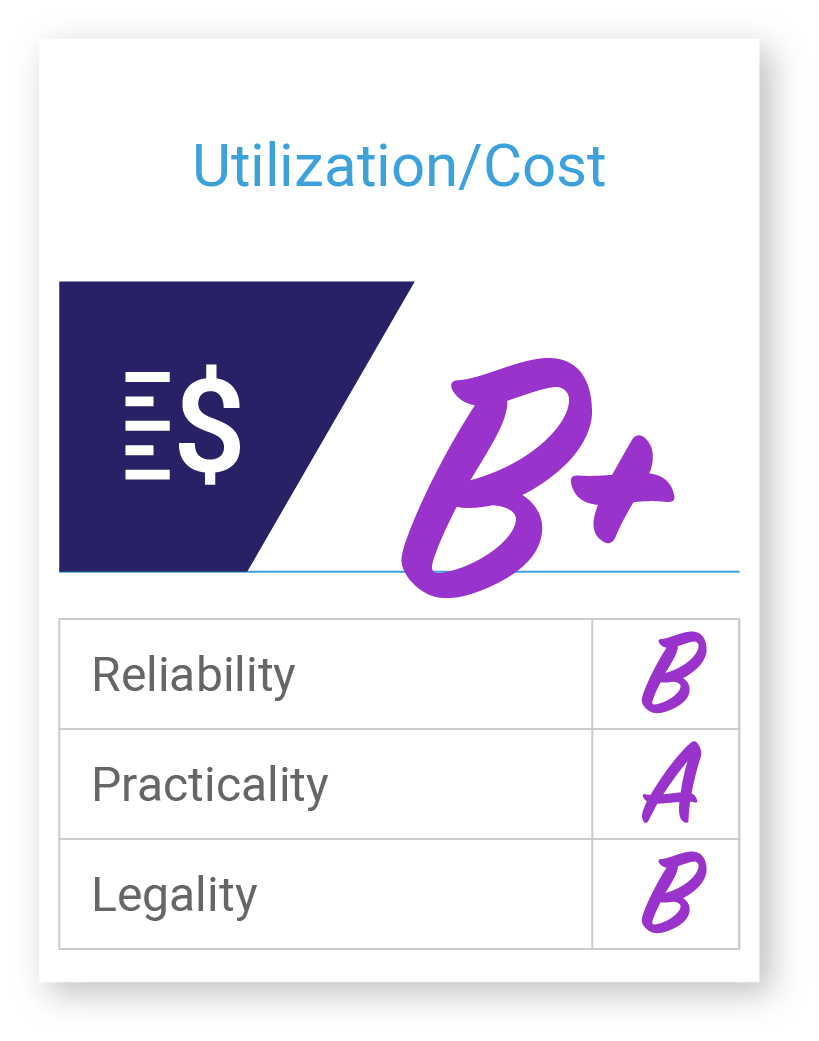
There are many utilization data variables that can be used to build the patient risk profile. Most of these include costs (medical and Rx), Emergency Room (ER) visits/observations, hospitalizations, readmissions, etc. Past utilization rates and patterns are used quite often as independent variables to predict future utilization as well as establishing concurrent risk under risk adjustment models like the one developed by the Department of Health and Human Services (HHS).
Most utilization data is found on claims data which use primarily ICD-CM, HCPCs, and CPT codes. Utilization data can also be extracted from EHRs for supplemental information to offset missing or lagged claims data. While the practicality and reliability of this data are high, it’s important to understand the claims payment lifecycle when determining what charges are being used to assess utilization. The most commonly used charge variable in care management stratification algorithms is the net incurred claims charge.
Surveys
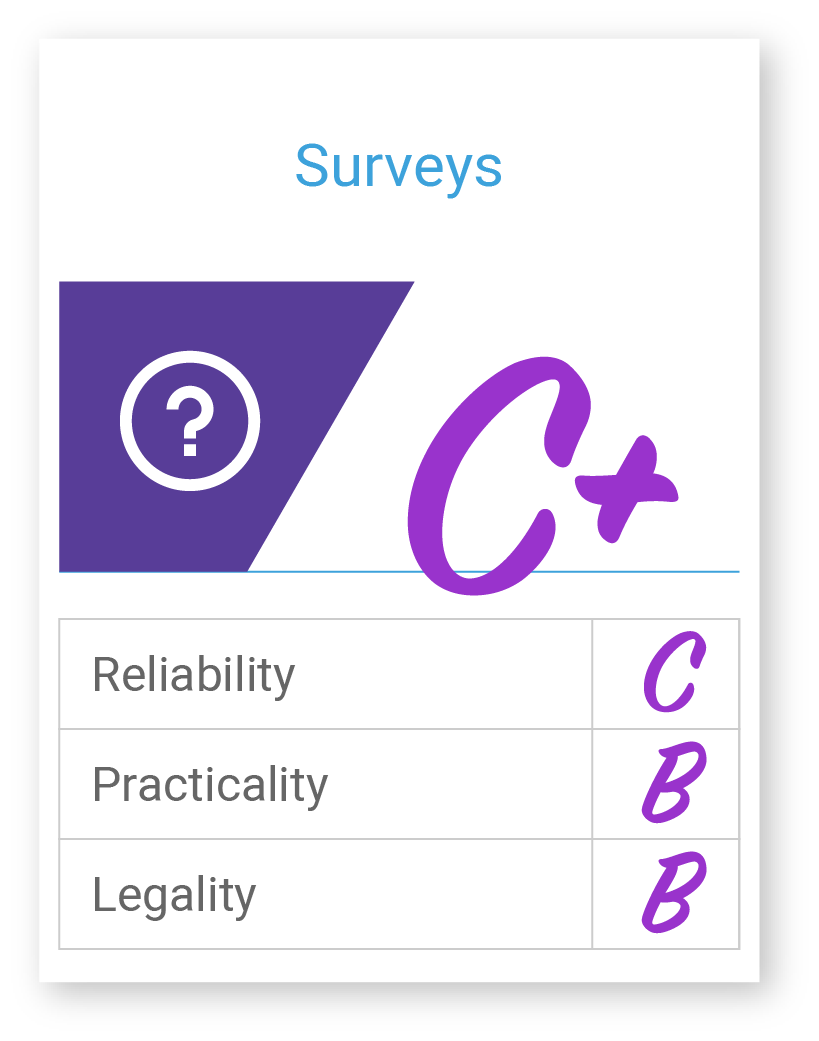
Survey data is typically collected from patient-reported questionnaires. Many survey templates are available in EHRs and embedded in various workflows across care delivery, coordination, and management. Survey data is most often focused on collecting lifestyle-related risk factors and patient-reported outcomes. Variables often included in care management frameworks consist of Personal disease history, Alcohol consumption, injury prevention behavior, diet, exercise, skin protection, stress, tobacco use, weight management, and women’s health.
Patient-reported data types are not well standardized across the industry. These data types are collected using various surveys including Health Risk Assessments (HRA), Patient Health Questionnaire (PHQ), Patient-Reported Outcomes Measures (PROMs), Life Event Checklist (LEC), Protocol for Responding to and Assessing Patients’ Assets, Risks, and Experiences (PREPARE), Health-Related Quality of Life (HRQOL), Activities of Daily Living (ADL) and Generalized Anxiety Disorder (GAD). Survey data is most often captured in the EHR or other external tools. The quality of this data is considered low for use in risk profiling due to the inherent biases associated with collection (.e.g, sampling/selection bias, response/nonresponse bias, etc.), but is a great source of information in understanding the needs of the patient that may go beyond the traditional zone of clinical influence.
Diagnostics (ordered/results)
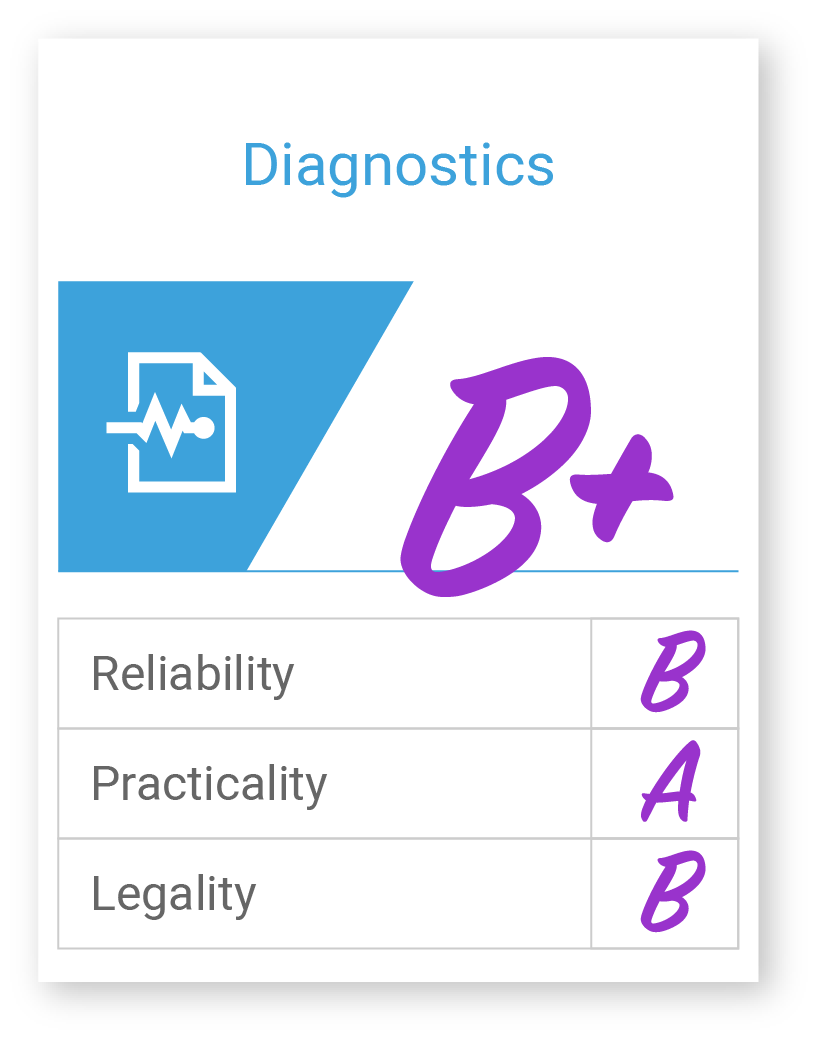
Diagnostic data types include variables from laboratory, pathology, radiology, as well as vital signs data. These are considered to be emerging data types. Capturing these data points over time can be extremely valuable in identifying patients with rising risk who may require additional coordination and care management to manage their increased risk.
Traditional diagnostics data mentioned above is typically sourced from EHRs or standalone information systems used by independent laboratories, which are not always integrated into the EHR. Coding standards do exist for diagnostic laboratory data including LOINC, SNOMED, and CPT. Although these data types are found in the EHR and standardized, making the data source fairly practical and reliable, there are a few considerations. First, different healthcare facilities may use different tests to measure the same analyte which will result in different lab codes being recorded. For vitals, a common issue is incorrect units, e.g., reporting pounds as kilograms and vice versa.
Lifestyle
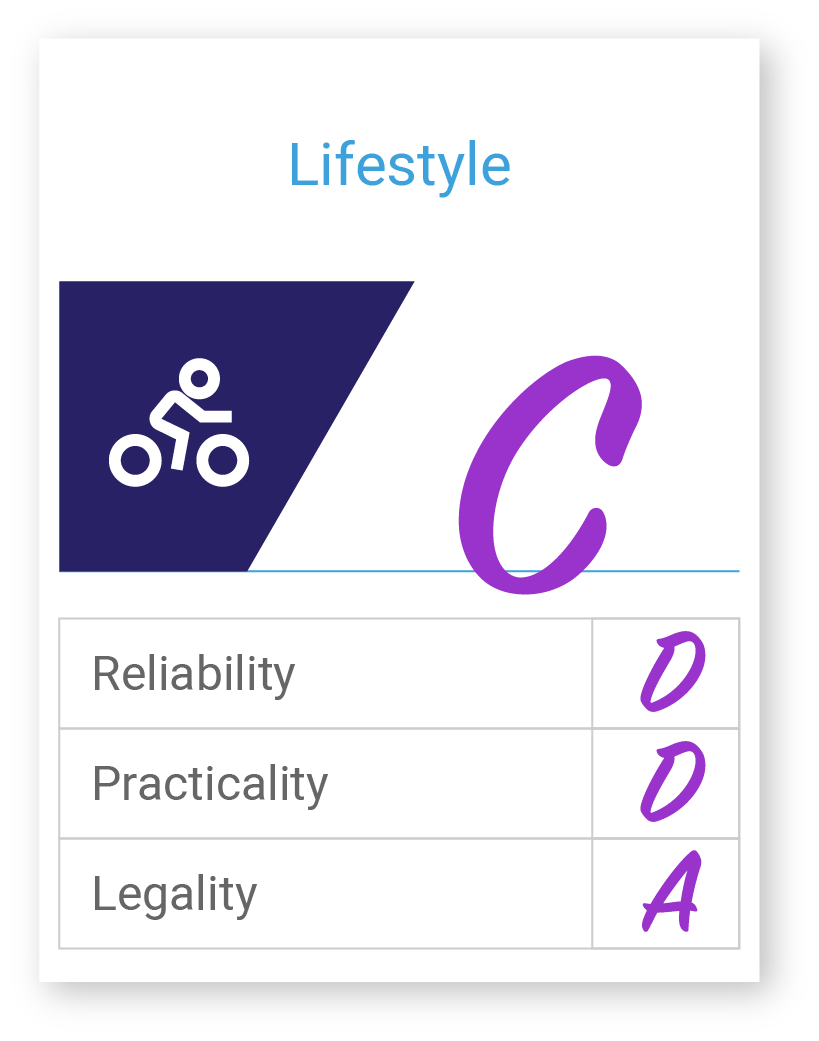
Lifestyle data types are another emerging type of information that is being incorporated into care management and coordination frameworks. These are things like alcohol and tobacco usage, injury prevention behavior (e.g., gun safety, wearing seat belts), Diet and exercise, skin protection, women’s health. A few of these variables are independent and can be correlated with higher costs and utilization, such as tobacco usage.
Lifestyle data are not well standardized. These data types are often collected through the use of in-house surveys/templates integrated into the EHR, but they are not standardized well across the collection, use, and sharing. Data quality issues exist particularly in the completeness of the data, and subjective bias in response surveys. It’s also important to recognize that nonclinical data may be subject to non-HIPAA rules, e.g., the Family Education Rights and Privacy Act (FERPA).
Social
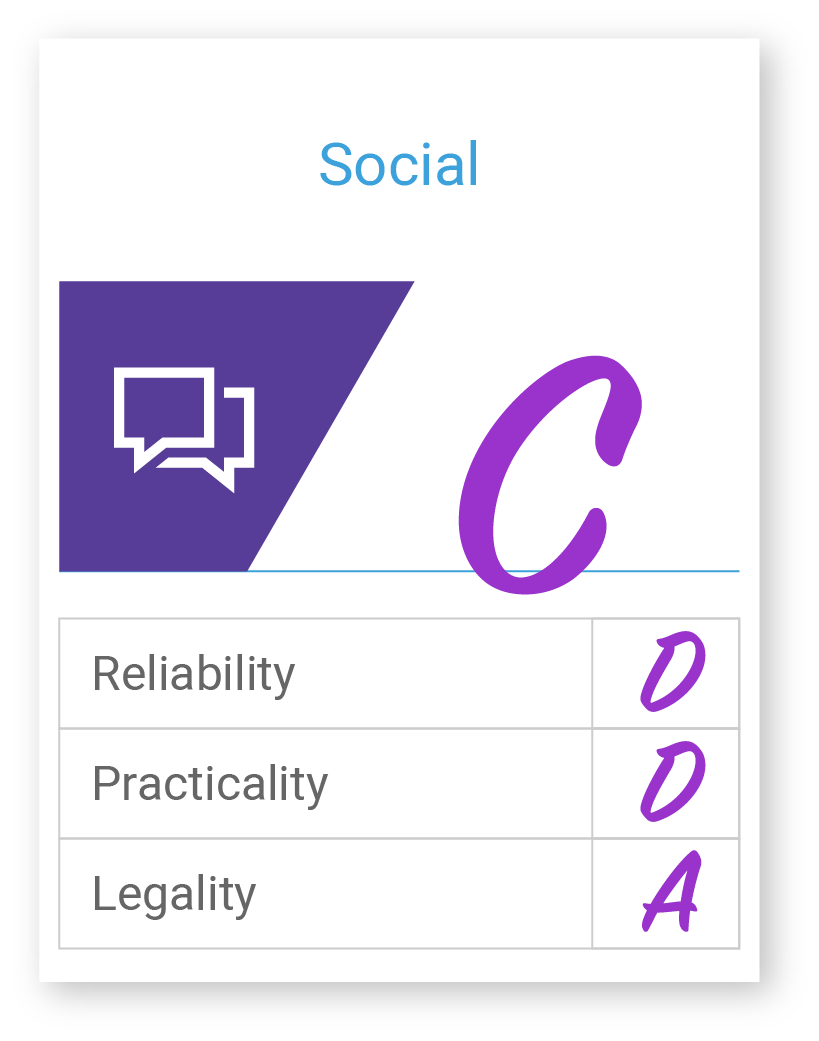
Social information is another emerging data type that is gaining a lot of traction right now in care management and financial administration. Variables include, but are not limited to income, education, dual eligibility, wealth, employment, language, nativity, acculturation, gender identity, sexual orientation, marital/partnership, living arrangements, support, area deprivation, urbanicity/rurality, environmental factors, etc. These data points are important for tailoring care plans as well as adjusting performance for purposes of public reporting and reimbursement.
Socioeconomic data types are not standardized and there is no formal coding system for capturing this information. There has been growing momentum on this endeavor, however, by the healthcare technology community including the Office of the National Coordinator for Healthcare Information Technology (ONC), Logical Observation Identifiers Names and Codes (LOINC), Social Interventions Research & Evaluation Network (SIREN), the Gravity project, the National Association of Community Health Centers and many others. Socioeconomic data is collected at the patient level as well as at the community level. There are many challenges with using patient-level data, which we will explore deeper in a later blog. The big challenge is that good patient-level data capture is time-consuming and estimated to take up to nine additional minutes per encounter. This has caused many providers to look at community-level data as a place to start. There are algorithms that use Census data from the American Community Survey to evaluate the deprivation of a specific area (e.g., State, Census Tract, Census Block, and even Census Block ID). These Area Deprivation Index scores can be helpful in identifying “potential” socioeconomic risks based on the patient’s address.
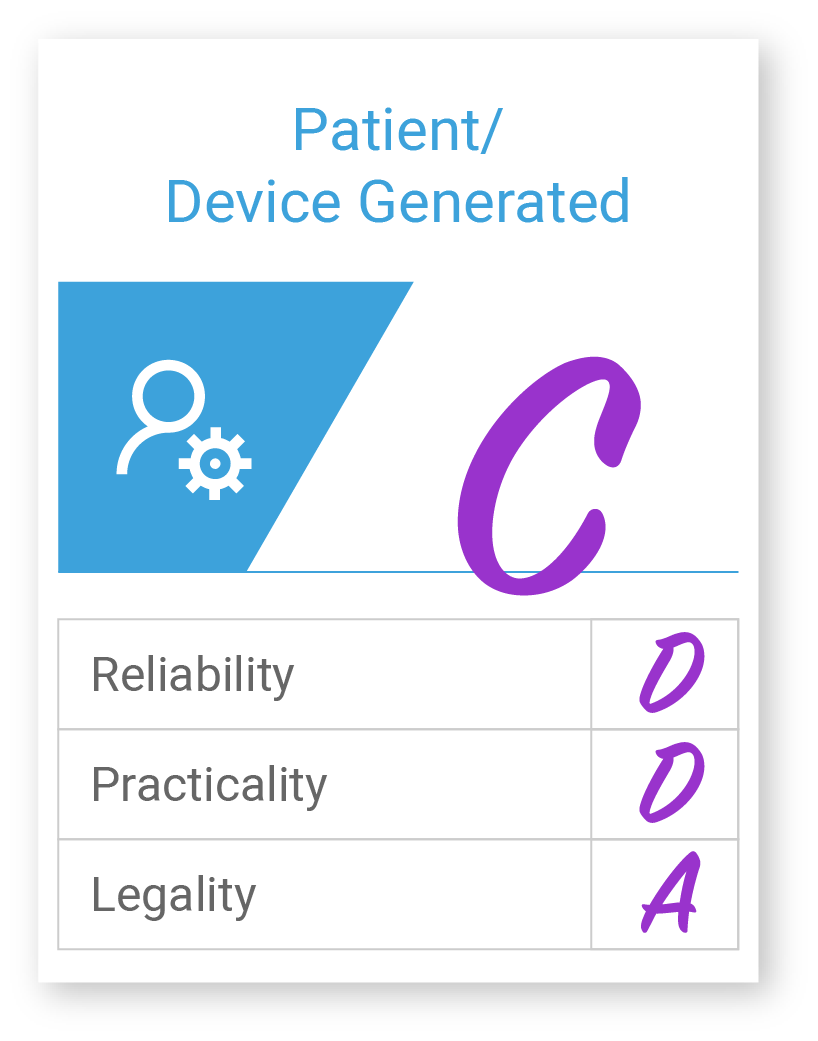
Patient/device-generated Data
Patient-generated data includes, but is not limited to physical activity, sleep patterns, blood sugar levels, etc. These are used as independent variables to understand short-term utilization trends but are most helpful in identifying patterns of general fitness and activities of daily living (frailty). These data points are not widely used in population health management activities yet, but there is growing interest in the collection, use, and sharing of this information to understand the needs of the population and to identify risky patients that could benefit from targeted intervention.
Patient and device-generated data is typically captured in the EHR through various means, including integrated personal health records, M-Health, and wearable device interfaces. Patient/Device generated data is highly customizable across platforms with no coding standards. Although the quality of data from mobile and wearable devices is improving, data that is self-reported remains highly variable and subject to error and bias. Legal concerns over the use and sharing of this data are also something that is quite frequently discussed in policy circles and something to consider going forward.
What’s Next
Check out our upcoming blog as we continue to examine the steps of population health monitoring, where we’ll take a deep dive into the intelligence and engagement layers of a care management platform. To learn more about Inflight Health 360-Degree Profiling solutions, contact a member of our Success team.


