
This series, “Playing the Long Game”, is all about achieving success in a population-based care management system. A population-based care management system applies care services across the full continuum of health, for all patients, with the aim of providing appropriate interventions based on the individual’s current health status and unique needs.
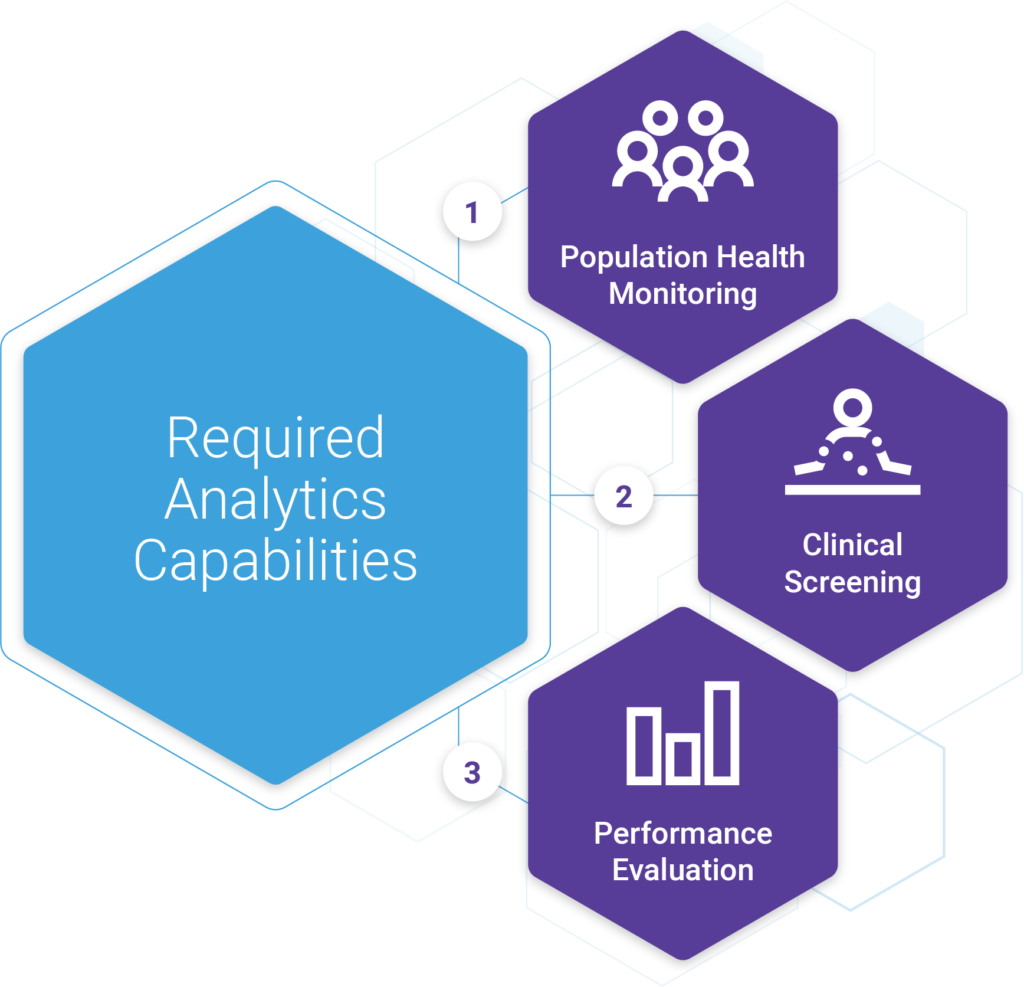
Achieving both clinical and financial success under this type of model requires that provider organizations have the information and tools necessary to efficiently carry out the activities of population health management, including health monitoring, clinical screening, and performance evaluation.
Population Health Monitoring
The whole goal of health monitoring is to ensure that organizations understand the needs of their patients so that they can deliver the appropriate care and connect them with the necessary resources and services.
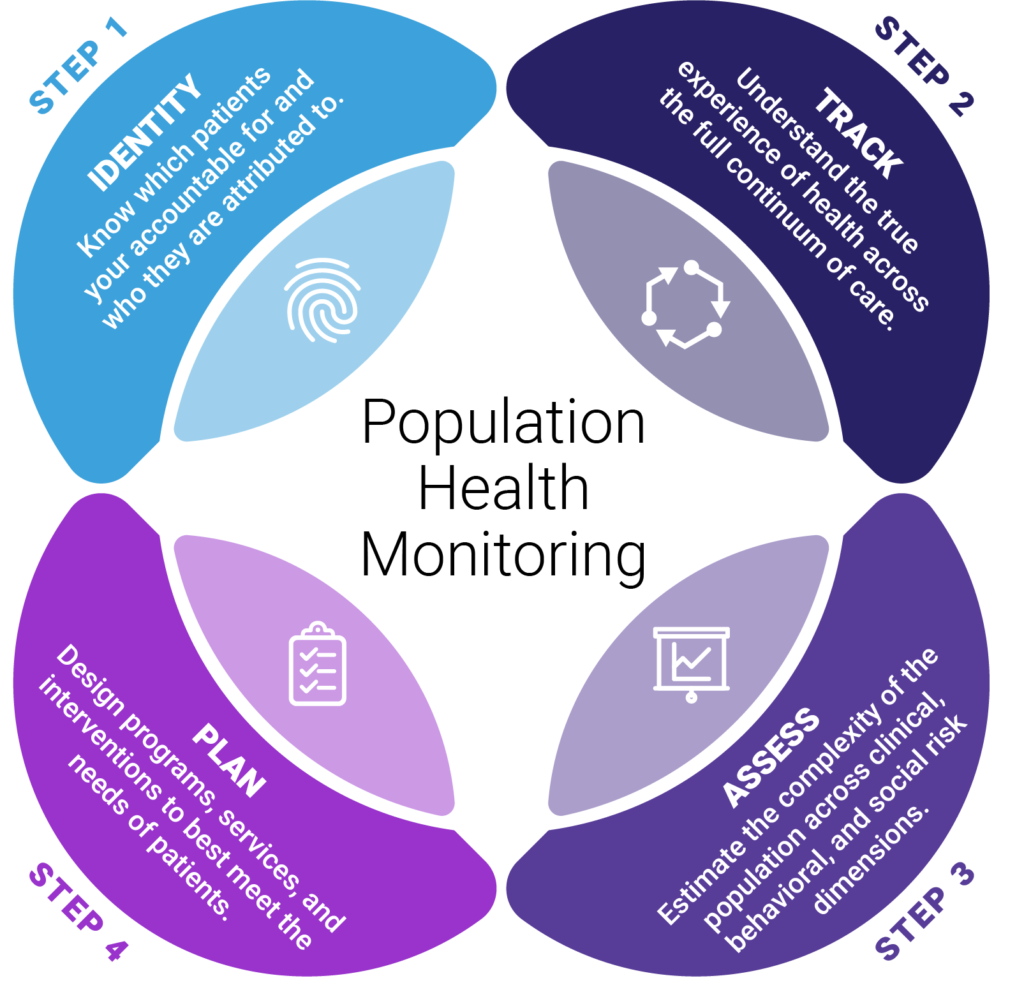
Effective population health monitoring is accomplished in four steps: Identifying patients, tracing their experience, assessing their risk, and planning appropriate interventions. We covered identification and tracing in parts 4 and 5. Once those capabilities and processes are in place, organizations can then shift efforts towards the assessment of risk and planning of interventions/programs.
Population Health Monitoring, an Approach to Risk Mitigation
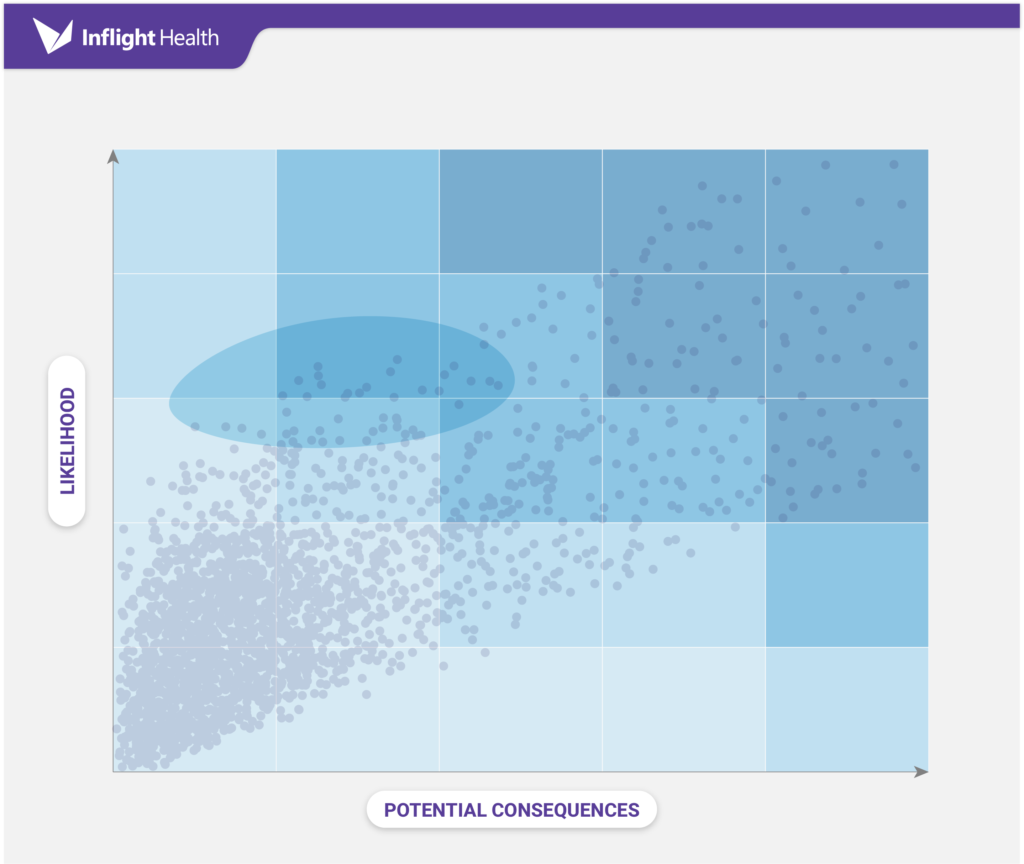
The assessment and planning phases of population health monitoring are based on the principles of risk mitigation. Risk mitigation focuses on assessing the likelihood of events, estimating the consequences, and then putting the appropriate interventions in place to decrease the negative effects.
Ideally, an organization would be prepared for all risks and threats. However, that may not be feasible in a resource-constrained environment. It’s important to weigh the impact of each risk and prioritize planning around that impact, it’s also critical to understand the economics of implementing a program, and then having a clear goal in mind as to what the goals are.
In most industries, the risk is equated to financial loss. In value-based care, there are three primary areas where financial loss can occur. They are (1) not capturing the case-mix complexity correctly for purposes of risk adjustment, (2) not closing open care gaps, and exceeding the negotiated per capita healthcare cost (i.e., PMPY).
It’s important to implement interventions across all three areas of risk. All but a very few patients should be scheduled for their annual wellness visit. Every patient that requires screenings or tests should receive close coordination from the care team to ensure that those gaps are closed. Patients that have been diagnosed with chronic conditions should be monitored, educated, and supported in managing their illness through targeted interventions. Only certain patients, however, should be placed under case management programs, which should be determined based on the need and opportunity to control costs, utilization, and slow the deterioration of health.
Asking the Right Questions
The identification and stratification of patients into these groups can be difficult without the right tools or asking the right questions.
In this next section, we’ll outline some important questions that program sponsors should be asking and provide examples of how grouper technology, like the Johns Hopkins ACG System, can be used to help answer these questions.
Question #1: What level of intervention will our patients require?
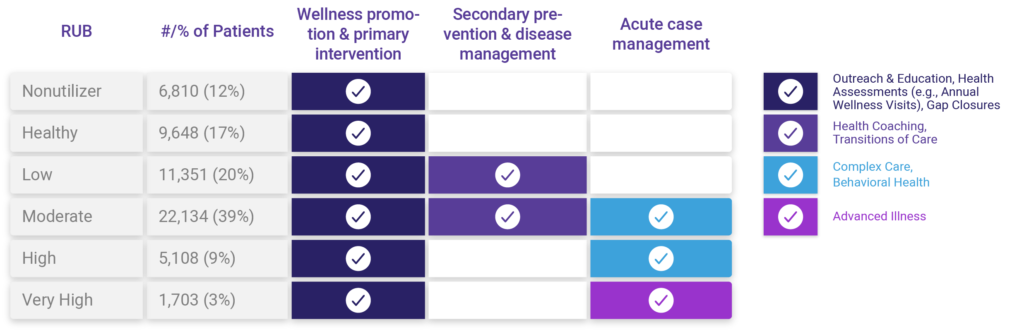
Recall, there are three levels of intervention in a population-based care management framework, they are (1) wellness promotion & primary intervention; (2) secondary intervention & disease management; and (3) acute case management. Each tier requires different resources and skillsets. Understanding what percentage of the population will require simple outreach versus complex case management is important to ensure programs are staffed accordingly and that reimbursement rates are equitable.
Answering this question requires the ability to segment a population by expected resource utilization and then align that with the appropriate intervention tier. In most cases, the level of intervention will align with the expected resource utilization; however, there will be overlap and further analysis/tweaking of the model will be needed for each population, to determine cutoffs based on the capabilities of the organization and potential ROI.
Developing this type of model from scratch can be costly and error-prone. Using a grouper solution, like the Johns Hopkins Adjusted Clinical Grouper (ACG) System, makes this type of analysis feasible and reliable. This capability is available out of the box with the ACG System. These segments are referred to as Resource Utilization Bands (RUBs). There are six RUBs ranging from non-utilizer to very high utilizer. RUBs are established based on a combination of factors including concurrent relative resource use, morbidity differentiation & duration, severity, diagnostic certainty, etiology, and need for specialty care. A RUB distribution report will provide a breakdown of the count of patients/ percentage of patients that fall into each group.
Question #2: What conditions should we focus on?
Now that we know what level of care is needed, we can shift focus to better understand what types of conditions are leading to higher levels of morbidity and expected resource utilization within the population. Knowing which conditions are higher than expected, based on the morbidity, age, and sex of the population is useful when prioritizing programs and intervention pathways to help control rising risk amongst the population.
This type of analysis requires the use of a clinical classification model, like the Johns Hopkins ACG System – Expanded Diagnosis Cluster (EDC) model. A clinical classification methodology assigns diagnosis codes found in claims or encounter data into condition types (e.g type II diabetes mellitus). The ACG System includes 286 EDC categories, which are further organized into 27 condition categories called Major Expanded Diagnosis Clusters (MEDCs ) for ease of administrative reporting.
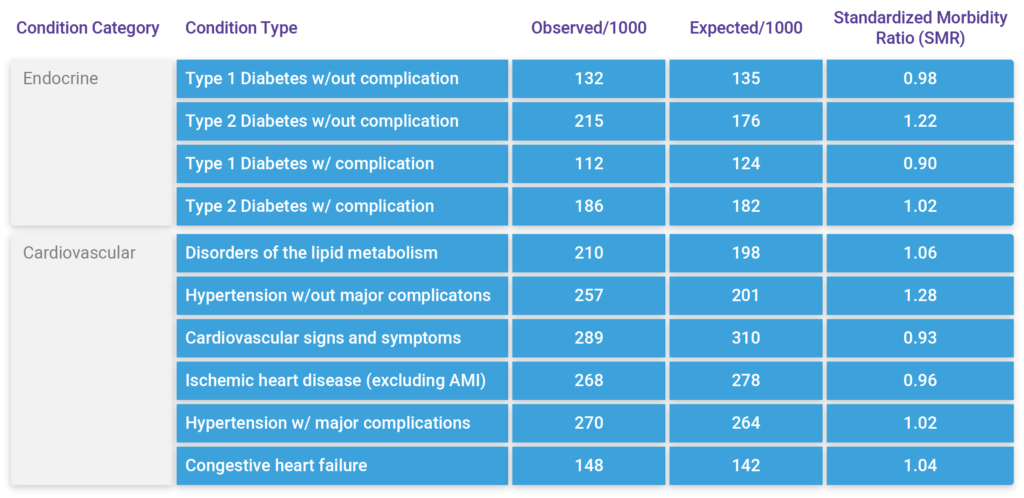
Answering this question also requires benchmarking capabilities to establish what level of morbidity is normal across the population. This is accomplished by comparing the observed counts/percentage to the expected counts/percentages, based on a similar group of patients. The ACG System provides these capabilities as well through the development and use of a large, representative reference population. The reference population is used as a control for a range of factors known to affect modeled health risks such as age, gender, and morbidity. Comparing expected versus observed conditions is what the ACG System calls Standardized Morbidity Ratios (SMRs).
Putting these capabilities together we can compare EDCs (Condition Type) that are observed within the population, to expected counts based on the reference population. Using Standardized Morbidity Ratios (SMRs), we can see that Type 2 Diabetes and hypertension w/out complications are two condition types where there may be an opportunity to focus resources and have a measurable impact. We can do this analysis at the population level or slice it by RUB group for more targeted analysis.
Question #3: What do we know about this particular group of patients?
Now that we have an idea of which condition types are leading to higher levels of morbidity, we may want to start thinking about standardizing care pathways and providing low intensive care management programs (e.g., Transitions, Health coaching, etc.) for patients with these conditions who are expected to have moderate resource use (i.e., Moderate RUB group). Similar conclusions may be drawn for more complex patients with complications and comorbidities with high or very high expected resource use.
Prior to committing resources towards program design and implementation, sponsors should conduct a deeper exploratory analysis of the population to better understand health and financial risks, as well as potential impacts. There are many factors to consider when determining if there is enough opportunity. This type of analysis must be concurrent and prospective looking to account for population risk at present as well as the future.
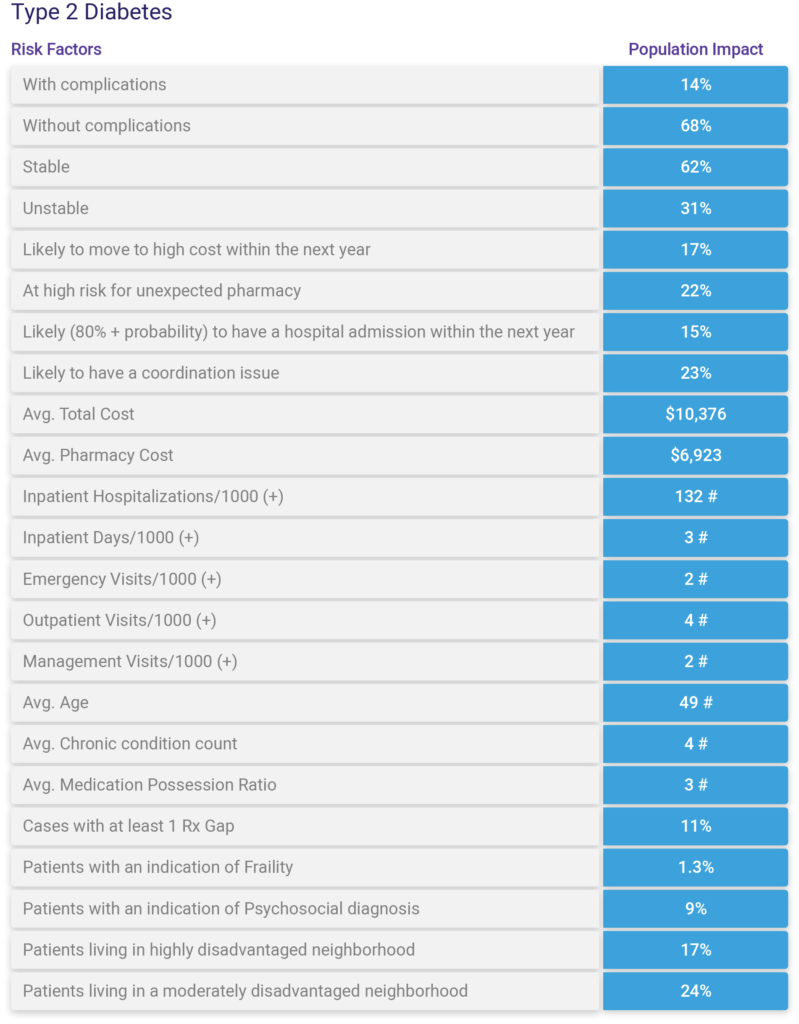
Using the Johns Hopkins ACG System, we can create profiles for an entire population or many subpopulations of interest. We can leverage out-of-the-box reports or customize our own using the hundreds of variables available within the ACG System combined with variables from Electronic health record systems, community-level information, as well as other data sources. This type of analysis is great for gaining a deeper understanding of overall risk and opportunities, but it’s also a great baseline for measuring performance pre-program implementation. An example of this type of profile/report is shown below.
Question #4: Is there enough opportunity to outweigh the costs?
Before we jump into program design, we mustn’t overlook the economics of program planning. In resource-constrained environments, it’s vital to make sure that care managers are allocated in the most effective way possible, based on where they can have the greatest impact.
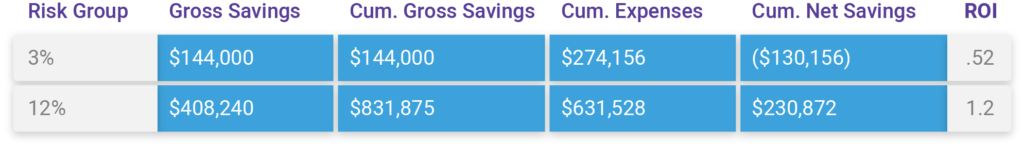
By now, we should have a good sense of where the need is and the level of resources that will be required. Next, we need to understand what it’s going to cost to deliver the support/services needed and the potential benefits/ROI of investing.
Using a simple Risk Management Economic Model, like the one developed by Ian Duncan, along with predictive analytics capabilities, the projected Return on Investment (ROI) can be calculated in roughly 5 steps. Check out our blog Five Steps to Understanding ROI in Care Management to explore this concept in more detail.
Question #5: Are there specific providers/clinics we should partner strategically with?
Now that we know what type of patients we’ll focus on, the level of care that will be needed, and the interventions that will be implemented, our next step is to establish a plan for rolling the program out to clinics. Most programs are introduced as a pilot. This approach allows organizations to test the effectiveness of a program or intervention on a smaller scale, before expanding it out to all clinics/providers. Analytics can be helpful to identify which providers should be engaged early on. This type of analysis is helpful to identify where clinics may be struggling or need additional resources to manage risk and patient outcomes more efficiently.
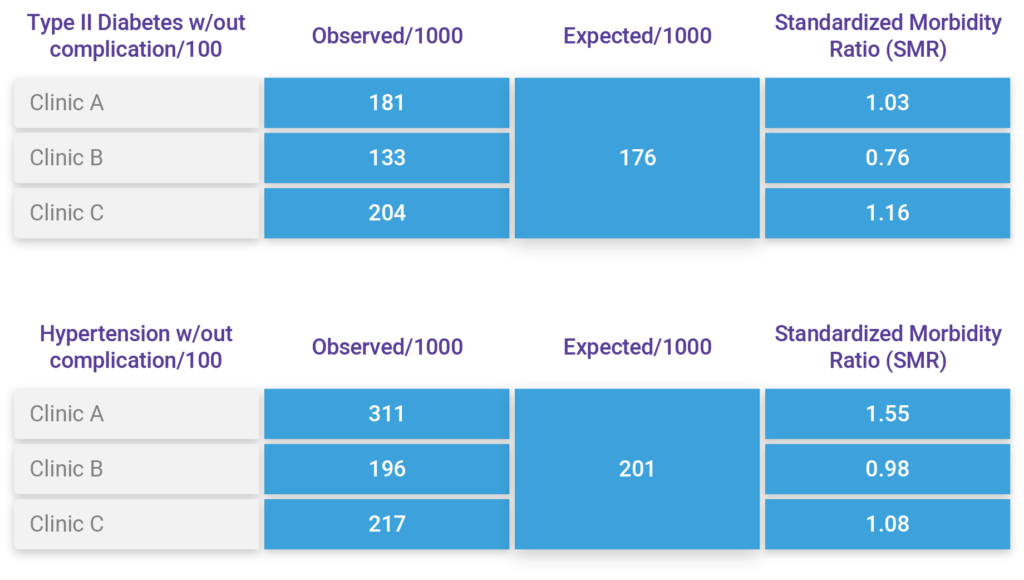
Using the Johns Hopkins ACG Standardized Morbidity Ratio (SMRs) by Condition Type (EDC) analysis report, we can identify which providers have a higher than normal volume of diabetic and hypertensive patients, compared to the reference population. It’s essentially what we did before, but adding in another dimension of the accountable provider/clinic. Using this report, we can see that Clinics A & C might be good candidates for a pilot, whereas it might not be as impactful for Clinic B (initially).
Question #6: What external relationships will be key to success?
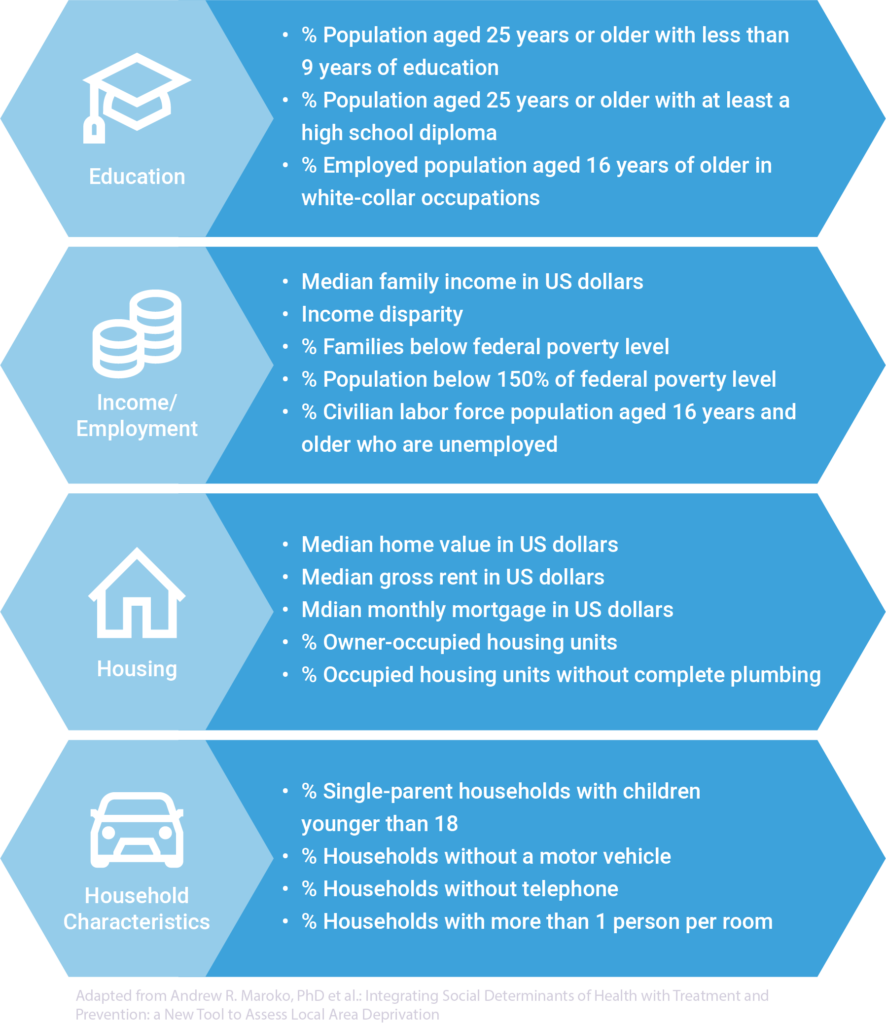
Recognizing that there are factors outside of the traditional zone of clinical influence that affects one’s health and ability to self-manage, organizations must consider the social, economic, and environmental variables involved and ensure that external relationships are fostered with community partners.
Predictive analytics have been used to establish a way to measure an area’s level of socioeconomic deprivation that is associated with health outcomes. These models are referred to as Area Deprivation Indices (ADIs). There are numerous ADIs available to the public, several well-known ADIs include, the Neighborhood Atlas and the Multidimensional Deprivation Index. Organizations like AARP have developed their own, as well as local government and public health offices, such as DuPage county. These models calculate a score based on Census variables across education, income/employment, housing, and household characteristic domains. Many are calculated on a national scale ranging from 1 – 100 or state scale ranging from 1 – 10. The higher the number, the more disadvantage a local is.
Parting Thoughts
In short, health monitoring is a vital step to success in a population-based care management system. Knowing your patients well enough to prescribe the necessary care and support is key. Doing this requires asking the right questions. Doing this effectively and efficiently requires the right tools.
Check out our upcoming blog as we examine the steps of clinical screening, where we’ll take a deep dive into the concepts and activities involved with identifying impactable patients for planned programs/targeted interventions. To learn more about Inflight Health population health monitoring solutions, contact a member of our Success team.